
Processor Trace: Do you remember the oldest method that we all used for analyzing the code instrumentation? Well, it will be the simple method of inserting any printf statement at the beginning of the function for counting the number of times the function was called in a program. For us, it was the most precise method of analyzing the performance application. As simple as it may look, it has a serious disadvantage. For example, if the code was to be compiled every time we wanted to check the performance of something different, then there would be an unnecessarily large overhead. In this article, we are going to discuss a revolutionary Technology that can help us to do the performance analysis without even disturbing the execution of a program.

WHAT IS PROCESSOR TRACING?
Process tracing is the feature that records the execution of a program by the method of encoding packets in a format that is very compressed. The main features of it being, it has very low overhead as well as very large coverage. It is similar to the Technique of Sampling as it does not require any modification in its source code. Intel Processor trace was a cool new feature that they added to their future processors. They thought it would be extremely helpful for debugging as it was meant to easily trace any activity with details and accuracy. It could also isolate the tracing that really mattered with the use of various capabilities of triggering and filtering. Intel also released a full library that enabled users to use the Processor Trace. They even had the sample tools released to go along with the Processor trace.
HOW DID Processor Trace WORK?
All that is needed to be done is running the program under the Processor Trace enabled tool. Once it is enabled, packets start to be written to the DRAM by the SW tools. Very similar to the LBR, the processor trace by Intel works by recording the branches. whenever the instruction is encountered by the CPU during the runtime what happened with this branch will be recorded. when we consider a simple jump instruction that is conditional, the CPU will have it recorded if it was taken or not taken. The CPU does it by just using one bit.
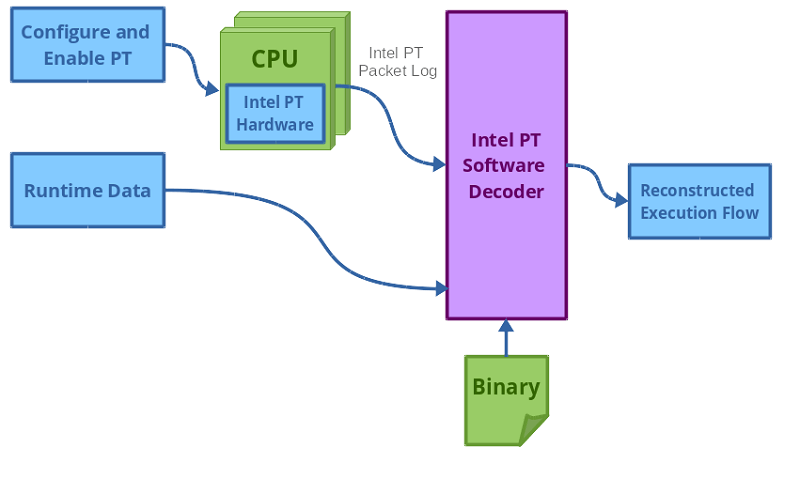
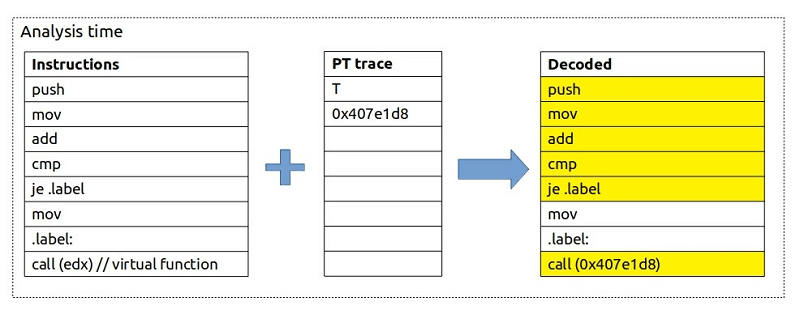
then the highly compressed program trace is stored by the CPU in the DRAM in the form of a binary. When we are trying to analyze, we have to bring together the processor trace that was collected and the application binary. The application binary file is needed by the SW decoder for the purpose of reconstructing the program’s execution flow. The entry point of the program is where it starts and then it makes use of all the collected traces just as the lookup reference for determining the control flow. Real dealing with a lot of data even if we used the traces in its compressed format.
Such a large amount of data makes it unsuitable for a lengthy workload. If you want to use it for bigger workloads, it can be run in small periods of time for overcoming this drawback. This makes the use case of processor trace different from that of profiling. Instead of attaching for the whole length of the process, It would be more efficient to attach it in the path with the glitch that occured. Another thing that we can do is to use a circular buffer in which the old traces are overwritten by the new traces.
If at any time it feels that there is too much data for handling, the data can be limited in its collection in various ways. we have to keep in mind that we can only limit the collecting traces on the user or kernel space code with various filter address ranges in which we can choose things for opting in and out. This greatly helps in limiting the bandwidth. doing this makes it possible for us to taste even a single function or any single loop. Another thing that we have to keep in mind is the decoding process itself takes a lot of time.
TRACING TIME
By using the processor trace, not only can we trace the flow of execution of a program but also the information on timing. It is a known observation that the instrumentation data of the control flow is found to be more accurate than the information on timing. It is important to have the information of the timestamp as it allows the programmer to align the interval of time in the program with any other event that is happening in the system simultaneously. it also makes it easy to compare the program with the time of the wall clock.
USES OF PROCESSOR TRACE:
The Processor Trace is of great use in the following situations:
- Introspecting Program Execution: It can immediately be found whether a code path was ever executed or not for proving the theory faster. We can also find how much time we have spent waiting while we are spinning on an attempt that is locked.
- Performance Glitch Analysis: Processor Trace is very useful if we want to analyze the performance glitches from a very detailed viewpoint.
- Accurate Profiling: Processor Trace can act as a provider of data for various profiling tools.
- Postmortem Analysis: The call stack information that is provided by the processor Trace is never invalid even when the stack is a corrupted one.